Market Outlook
December 14, 2017
Market Cues
Domestic Indices
Chg (%)
(Pts)
(Close)
Indian markets are likely to open flat tracking global indices and SGX Nifty.
BSE Sensex
(0.5)
(175)
33,053
After an early move to the upside, US markets remain mostly positive in mid-day
Nifty
(0.5)
(47)
10,193
trading on Wednesday. The upward move on the day has lifted the Dow and the
Mid Cap
(0.8)
(143)
16,791
S&P 500 reached new record intraday highs. The strength on Wall Street comes as
Small Cap
(0.8)
(146)
17,982
traders await the Federal Reserve's monetary policy announcement due this
Bankex
(0.7)
(186)
28,272
afternoon. With the Fed widely expected to raise interest rates by a quarter point,
traders are likely to keep a close eye on the accompanying statement as well as
outgoing Fed Chair Janet Yellen's press conference for clues about the outlook for
Global Indices
Chg (%)
(Pts)
(Close)
future rate hikes.
Dow Jones
0.3
81
24,585
The majority of the European markets ended Wednesday's session in the red.
Nasdaq
0.2
13
6,876
Traders were in a cautious mood ahead of today's announcement from the Federal
FTSE
(0.1)
(4)
7,497
Reserve. Investors are also looking forward to policy decisions from the European
Nikkei
(0.5)
(108)
22,758
Central Bank, Bank of England and Swiss National Bank on Thursday.
Hang Seng
1.5
428
29,222
The Indian markets ended lower on Wednesday, extending losses to a second
Shanghai Com
0.7
22
3,303
successive session, as investors chose to take some profits after data released on
Tuesday evening showed consumer price inflation to have risen steeply in November
Advances / Declines
BSE
NSE
and pace of growth of industrial output to have slowed in October.
Advances
897
558
News Analysis
Declines
1,798
1,206
Maruti follows Tata Motors, Honda; to raise car prices by up to 2% from Jan
Unchanged
142
64
Detailed analysis on Pg2
Volumes (` Cr)
Investor’s Ready Reckoner
BSE
4,467
Key Domestic & Global Indicators
NSE
27,652
Stock Watch: Latest investment recommendations on 150+ stocks
Refer Pg5 onwards
Net Inflows (` Cr)
Net
Mtd
Ytd
Top Picks
FII
(136)
(3,579)
54,054
CMP
Target
Upside
Company
Sector
Rating
MFs
864
4,436 1,14,674
(`)
(`)
(%)
Blue Star
Capital Goods Accumulate
794
867
9.2
Dewan Housing Finance
Financials
Buy
578
712
23.2
Top Gainers
Price (`)
Chg (%)
Asian Granito
Other
Accumulate
509
570
12.0
Lti
1,064
6.5
Navkar Corporation
Other
Buy
192
265
38.2
Strtech
295
4.9
KEI Industries
Capital Goods Accumulate
382
436
14.1
Paragmilk
271
4.1
More Top Picks on Pg4
Hindcopper
93
3.9
Key Upcoming Events
Jklakshmi
428
3.9
Previous
Consensus
Date
Region
Event Description
Reading
Expectations
Dec14
China
Industrial Production (YoY)
6.20
Top Losers
Price (`)
Chg (%)
Dec14
India
Monthly Wholesale Prices YoY%
3.59
Unitech
7
(13.8)
Dec14
UK
BOE Announces rates
0.50
0.50
Videoind
18
(4.9)
Dec14
Euro Zone ECB announces interest rates
-
Renuka
16
(4.4)
Dec14
US
Industrial Production
0.94
More Events on Pg7
Religare
57
(4.3)
Muthootfin
414
(4.2)
As on December 13 2017
Market Outlook
December 14, 2017
News Analysis
Maruti follows Tata Motors, Honda; to raise car prices by up to
2% from Jan
Country's largest carmaker Maruti Suzuki India (MSI) plans to increase prices
across its models by up to 2% from January in order to partially offset the rise in
input costs.
The company currently sells a range of models, from hatchback Alto 800 with
price starting at `2.45 lakh to crossover S-Cross priced at `11.29 lakh (all prices
ex-showroom Delhi). According to company, PTI that the company is revising
prices as there has been a gradual increase in commodity prices over the past few
months.
The quantum of price increase will vary based on the different models and fuel
specifications. The prices would go up to 2 per cent across the product portfolio
from next month. Various automakers such as Tata Motors, Ford, Toyota Kirloskar
Motor, Honda Cars India, Skoda and Isuzu have already announced price hikes
from early next year.
Economic and Political News
July-September current account deficit halves to 1.2% of GDP
NHAI to award 3,500 km of work by Dec end in a bid to speed up projects
MP approves `7,546cr Narmada, Parvati linking project for irrigation
Corporate News
Tata Communications board approves demerger of surplus land via HPIL
SAIL says board approved JV with ArcelorMittal for automotive steel
PVR to invest `70cr to build 21 4DX screens by 2019
Market Outlook
December 14, 2017
Top Picks HHHHH
Market Cap
CMP
Target
Upside
Company
Rationale
(` Cr)
(`)
(`)
(%)
Strong growth in domestic business due to its leade`hip
in acute therapeutic segment. Alkem expects to launch
Alkem Laboratories
25,040
2,094
2,341
11.8
more products in USA, which bodes for its international
business.
We expect the company would report strong profitability
Asian Granito
1,531
509
570
12.0
owing to better product mix, higher B2C sales and
amalgamation synergy.
Favorable outlook for the AC industry to augur well for
Cooling products business which is out pacing the
Blue Star
7,615
794
867
9.2
market growth. EMPPAC division's profitability to
improve once operating environment turns around.
With a focus on the low and medium income (LMI)
consumer segment, the company has increased its
Dewan Housing Finance
18,120
578
712
23.2
presence in tier-II & III cities where the growth
opportunity is immense.
Loan growth is likely to pick up after a sluggish FY17.
Lower credit cost will help in strong bottom-line growth.
Karur Vysya Bank
8,371
116
180
55.2
Increasing share of CASA will help in NIM
improvement.
High order book execution in EPC segment, rising B2C
KEI Industries
2,995
382
436
14.1
sales and higher exports to boost the revenues and
profitability
Expected to benefit from the lower capex requirement
Music Broadcast
2,197
385
434
12.7
and 15 year long radio broadcast licensing.
Massive capacity expansion along with rail advantage
Navkar Corporation
2,885
192
265
38.2
at ICD as well CFS augur well for the company
Strong brands and distribution network would boost
Siyaram Silk Mills
3,412
728
800
9.9
growth going ahead. Stock currently trades at an
inexpensive valuation.
Market leadership in Hindi news genre and no.
2
viewership ranking in English news genre, exit from the
TV Today Network
2,307
387
435
12.5
radio business, and anticipated growth in ad spends by
corporate to benefit the stock.
After GST, the company is expected to see higher
volumes along with improving product mix. The Gujarat
Maruti Suzuki
2,75,213
9,111
9,674
6.2
plant will also enable higher operating leverage which
will be margin accretive.
We expect loan book to grow at 24.3% over next two
GIC Housing
2,203
409
655
60.1
year; change in borrowing mix will help in NIM
improvement
We expect CPIL to report net Revenue/PAT CAGR of
~17%/16% over FY2017-20E mainly due to healthy
7,257
327
400
22.5
growth in plywood & lamination business, forayed into
Century Plyboards India
MDF & Particle boards on back of strong brand &
distribution network.
We expect sales/PAT to grow at 13.5%/20% over next
LT Foods
2,107
79
96
21.5
two years on the back of strong distribution network &
addition of new products in portfolio.
We expect sales/PAT to grow at 13%/18% over next two
years on the back of strong healthy demand in writing
Ruchira Papers
431
192
256
33.0
& printing paper and Kraft paper. Further, China had
banned making paper from waste pulp which would
benefit Indian paper companies.
Source: Company, Angel Research
Market Outlook
December 14, 2017
Key Upcoming Events
Global economic events release calendar
Bl oomberg Data
D ate
Time
C ountry
Event Description
Unit
Period
L ast Reporte d
E stimate d
Dec 14, 2017
7:30 AM China
Industrial Production (YoY)
% Change
Nov
6.20
12: 00 PM India
Monthly Wholesale Prices YoY%
% Change
Nov
3.59
5:30 PM UK
BOE Announce s rate s
% Ratio
Dec 14
0.50
0.50
6:15 PM Euro Zone ECB announces interest rates
%
Dec 14
-
7:45 PM US
Industrial Production
%
Nov
0.94
Dec 15, 2017
3:30 PM Euro Zone Euro-Zone CPI (YoY)
%
Nov F
1.40
Dec 18, 2017
12: 30 AM US
FOMC rate decision
%
Dec 13
1.25
1.50
Dec 19, 2017
7:00 PM US
Housi ng Starts
Thousands
Nov
1,290.00
7:00 PM US
Building permits
Thousands
Nov
1,316.00
Dec 20, 2017
8:30 PM US
Existing home sales
Million
Nov
5.48
Dec 22, 2017
8:30 PM US
New home sales
Thousands
Nov
685.00
3:00 PM UK
GDP (YoY)
% Change
3Q F
1.50
Dec 27, 2017
8:30 PM US
Consumer Confidence
S.A./ 1985=100
Dec
129.50
Feb 14, 2018
12: 30 PM Germany GDP nsa (YoY)
% Change
4Q P
2.30
Source: Bloomberg, Angel Research
Market Outlook
December 14, 2017
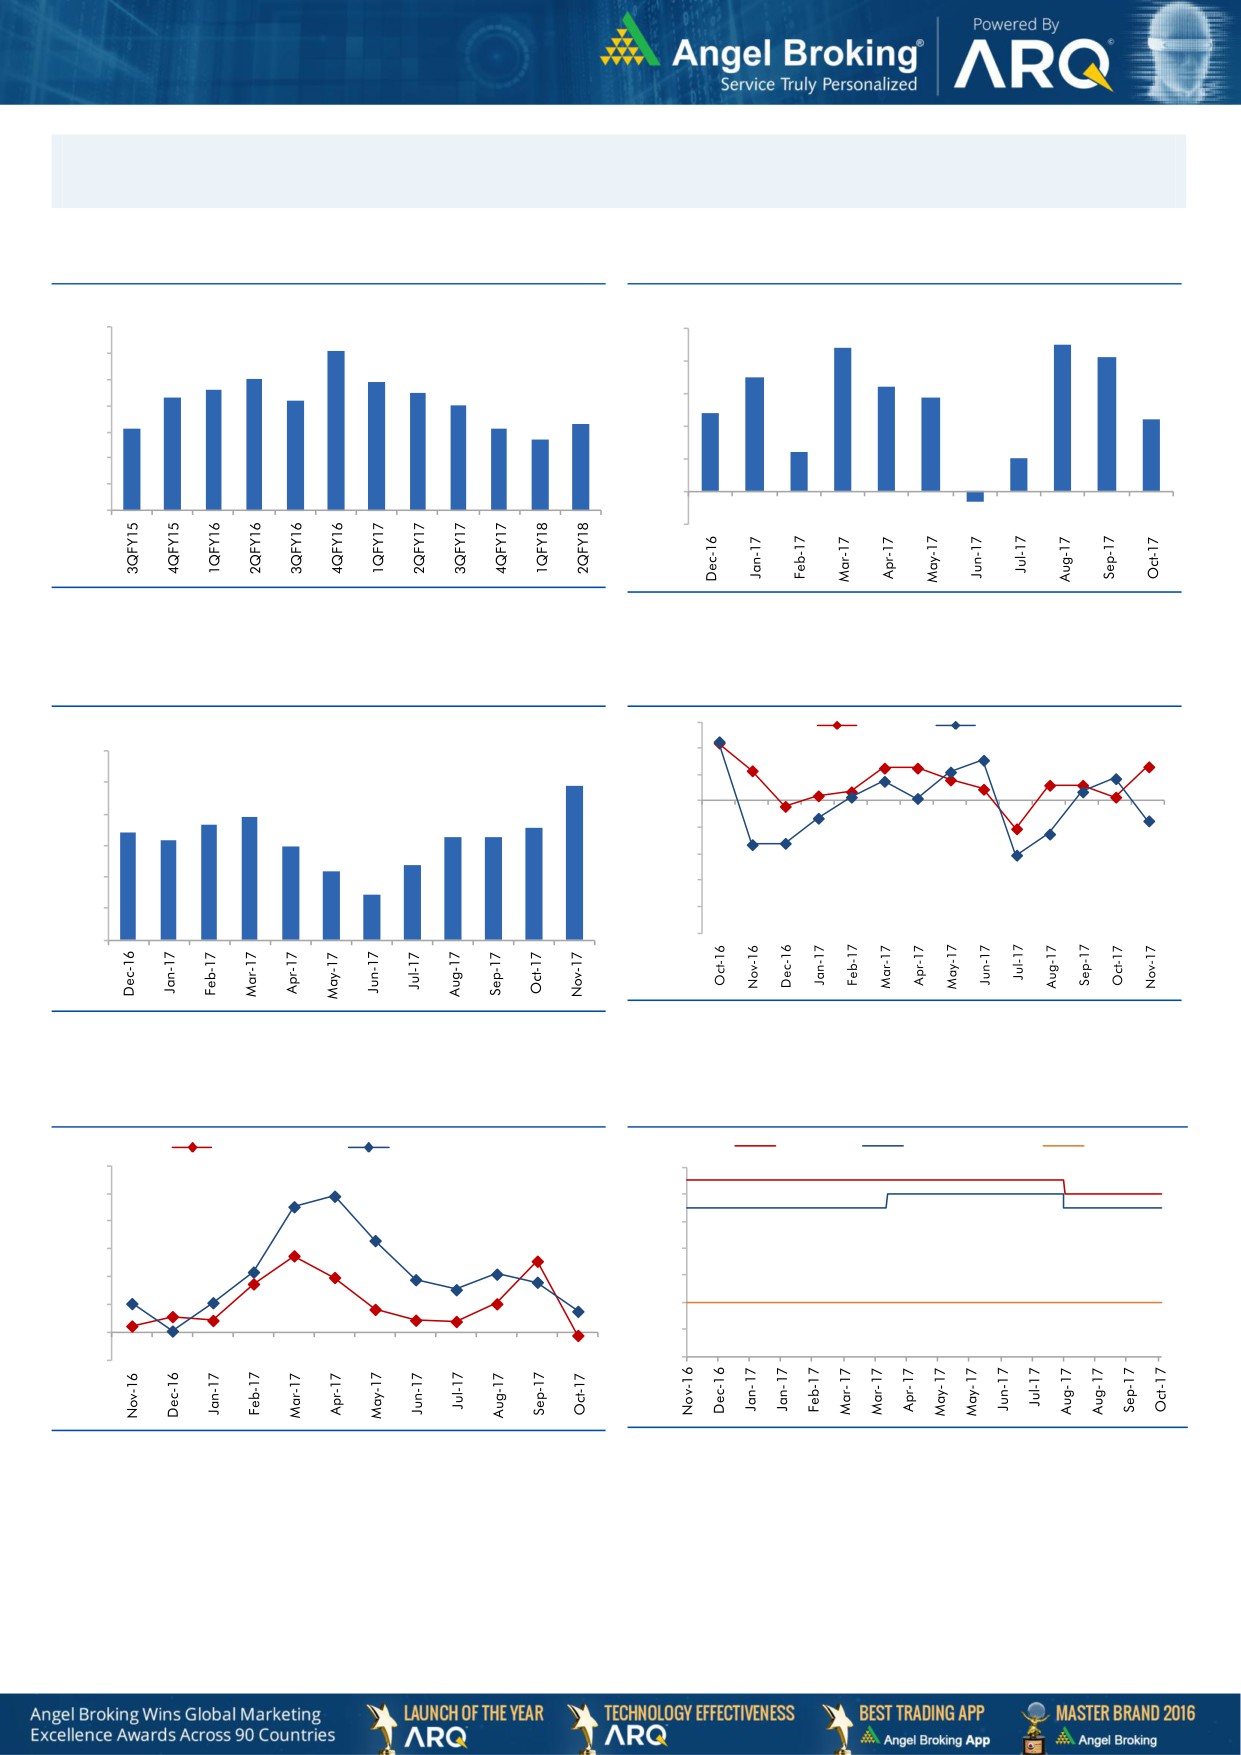
Macro watch
Exhibit 1: Quarterly GDP trends
Exhibit 2: IIP trends
(%)
(%)
10.0
5.0
4.5
9.1
4.4
4.1
9.0
8.0
7.9
4.0
3.5
7.6
7.5
3.2
8.0
7.3
7.2
2.9
7.0
3.0
2.4
7.0
6.3
2.2
6.1
6.1
5.7
2.0
6.0
1.2
1.0
5.0
1.0
4.0
-
3.0
(1.0)
(0.3)
Source: CSO, Angel Research
Source: MOSPI, Angel Research
Exhibit 3: Monthly CPI inflation trends
Exhibit 4: Manufacturing and services PMI
56.0
Mfg. PMI
Services PMI
(%)
6.0
54.0
4.9
52.0
5.0
3.9
50.0
3.7
3.6
4.0
3.4
3.3
3.3
3.2
3.0
48.0
3.0
2.4
2.2
46.0
2.0
1.5
44.0
1.0
42.0
40.0
-
Source: Market, Angel Research; Note: Level above 50 indicates expansion
Source: MOSPI, Angel Research
Exhibit 5: Exports and imports growth trends
Exhibit 6: Key policy rates
(%)
Exports yoy growth
Imports yoy growth
(%)
Repo rate
Reverse Repo rate
CRR
60.0
6.50
50.0
6.00
40.0
5.50
30.0
5.00
20.0
4.50
10.0
4.00
0.0
3.50
(10.0)
3.00
Source: Bloomberg, Angel Research
Source: RBI, Angel Research
Market Outlook
December 14, 2017
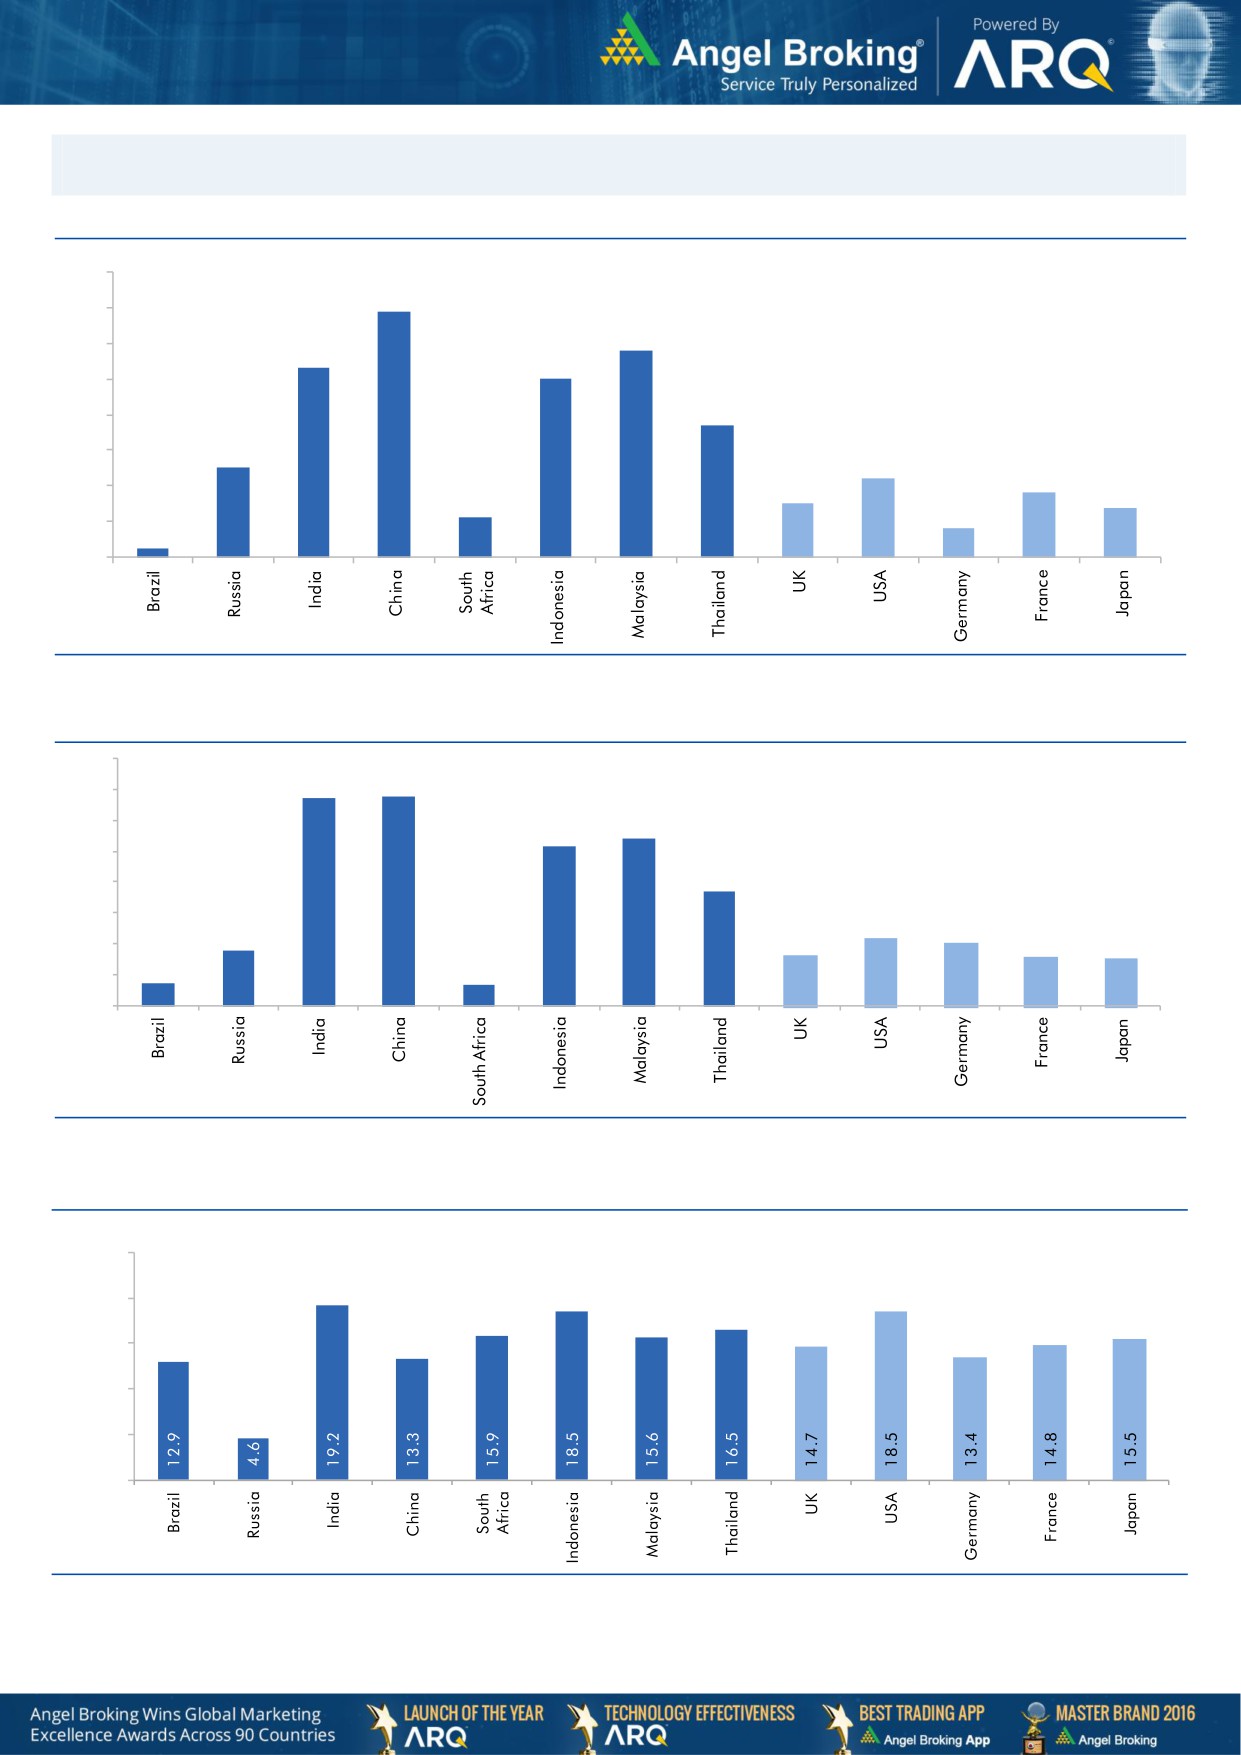
Global watch
Exhibit 1: Latest quarterly GDP Growth (%, yoy) across select developing and developed countries
(%)
8.0
6.9
7.0
5.8
6.0
5.3
5.0
5.0
1.1
3.7
4.0
2.5
3.0
2.2
1.8
2.0
1.5
1.4
0.8
1.0
0.3
-
Source: Bloomberg, Angel Research
Exhibit 2: 2017 GDP Growth projection by IMF (%, yoy) across select developing and developed countries
(%)
6.7
6.8
7.0
6.0
5.4
5.2
5.0
3.7
4.0
3.0
1.8
2.2
2.0
1.7
1.6
2.0
0.7
1.5
0.7
1.0
-
Source: IMF, Angel Research
Exhibit 3: One year forward P-E ratio across select developing and developed countries
(x)
25.0
20.0
15.0
10.0
5.0
-
Source: IMF, Angel Research
Stock Watch
December 14, 2017
Company Name
Reco
CMP
Target
Mkt Cap
Sales ( Čcr )
OPM(%)
EPS (Č)
PER(x)
P/BV(x)
RoE(%)
EV/Sales(x)
(Č)
Price ( Č)
( Č cr )
FY18E FY19E
FY18E
FY19E
FY18E
FY19E
FY18E
FY19E
FY18E
FY19E
FY18E
FY19E
FY18E
FY19E
Agri / Agri Chemical
Rallis
Reduce
235
209
4,569
1,873
2,099
15.0
15.0
9.5
10.5
24.7
22.4
3.8
3.4
15.8
16.0
2.3
2.1
United Phosphorus
Accumulate
726
820
36,919
18,922
21,949
18.0
18.5
36.2
45.6
20.1
15.9
4.2
3.5
22.7
23.8
2.1
1.8
Auto & Auto Ancillary
Ashok Leyland
Accumulate
114
127
33,340
23,339
27,240
10.1
10.8
4.7
6.2
24.5
18.3
4.9
4.3
20.0
23.6
1.4
1.2
Bajaj Auto
Neutral
3,149
-
91,132
23,936
27,955
19.5
20.1
142.7
167.3
22.1
18.8
4.8
4.3
21.8
22.8
3.4
2.9
Bharat Forge
Buy
687
875
31,974
7,637
8,755
21.7
23.2
36.1
47.3
19.0
14.5
3.4
2.9
18.5
20.8
4.0
3.4
Eicher Motors
Neutral
28,721
-
78,227
19,043
22,837
19.5
19.9
835.4
1,019.0
34.4
28.2
12.8
9.9
40.9
37.8
4.0
3.3
Gabriel India
Neutral
191
-
2,739
1,782
2,033
9.7
10.2
7.1
8.9
26.9
21.5
5.4
4.6
21.0
22.2
1.5
1.3
Hero Motocorp
Buy
3,422
4,129
68,337
32,239
36,878
16.0
15.6
184.4
206.5
18.6
16.6
5.8
5.1
31.3
30.7
1.9
1.6
Jamna Auto Industries Neutral
64
-
2,536
1,441
1,662
14.4
14.8
13.9
17.6
4.6
3.6
1.3
1.0
30.0
31.0
1.8
1.5
Mahindra and Mahindra Neutral
1,413
-
87,804
46,971
53,816
13.6
14.0
67.7
79.8
20.9
17.7
3.0
2.7
15.0
15.9
1.8
1.5
Maruti
Accumulate
9,111
9,674
275,213
79,470
95,208
15.9
17.2
281.7
363.8
32.3
25.0
7.0
5.7
21.7
22.8
3.1
2.5
Minda Industries
Neutral
1,114
-
9,627
4,328
5,084
11.0
11.9
27.3
36.4
40.9
30.6
8.7
6.8
23.1
25.6
2.3
2.0
Motherson Sumi
Neutral
367
-
77,354
55,937
64,445
10.8
11.4
16.9
21.1
21.7
17.5
4.9
5.0
25.2
25.4
1.4
1.2
Tata Motors
Neutral
402
-
116,028
303,167
343,649
11.8
13.8
33.1
54.7
12.1
7.4
2.0
1.6
16.9
23.0
0.4
0.4
TVS Motor
Neutral
745
-
35,406
13,992
16,216
9.0
9.4
17.1
20.3
43.7
36.7
11.6
9.0
29.7
27.7
2.5
2.1
Amara Raja Batteries
Accumulate
778
858
13,286
6,140
7,122
14.3
15.6
29.3
39.0
26.5
19.9
4.5
3.8
17.1
19.0
2.2
1.9
Exide Industries
Neutral
205
-
17,387
8,689
9,854
15.1
15.2
9.7
11.0
21.2
18.6
3.8
3.3
15.7
16.1
1.7
1.5
Apollo Tyres
Neutral
245
-
14,015
15,739
17,326
13.3
14.6
20.4
26.7
12.0
9.2
1.5
1.3
20.4
26.7
1.1
1.0
Ceat
Neutral
1,725
-
6,976
6,661
7,717
11.1
14.2
116.2
178.2
14.9
9.7
2.6
2.1
15.2
21.3
1.2
1.0
JK Tyres
Neutral
135
-
3,055
8,318
9,239
16.2
16.4
21.0
27.5
6.4
4.9
1.3
1.0
19.1
20.4
0.8
0.7
Swaraj Engines
Neutral
1,940
-
2,409
788
889
16.4
16.5
71.6
81.0
27.1
24.0
7.8
7.3
29.6
31.0
2.7
2.4
Subros
Neutral
260
-
1,562
1,855
2,135
11.6
11.8
10.3
14.7
25.4
17.8
3.9
3.3
15.8
19.1
1.1
0.9
Capital Goods
BEML
Neutral
1,500
-
6,245
4,286
5,194
7.1
8.2
42.9
58.1
35.0
25.8
2.9
2.6
7.6
8.7
1.5
1.2
Bharat Electronics
Neutral
181
-
44,386
10,258
12,470
19.6
19.5
7.3
8.6
24.8
21.0
0.5
0.4
20.4
21.9
3.8
3.1
Voltas
Neutral
619
-
20,485
6,778
8,004
9.6
11.0
17.1
22.4
36.2
27.6
8.6
7.6
17.7
19.8
2.7
2.3
BHEL
Neutral
90
-
32,877
33,200
39,167
6.8
9.5
6.2
11.2
14.4
8.0
0.7
0.6
4.6
8.0
0.6
0.4
Blue Star
Accumulate
794
867
7,615
5,220
6,207
6.3
6.6
16.8
22.3
47.3
35.6
9.4
8.3
19.9
23.3
1.4
1.2
CG Power and Industrial
Neutral
86
-
5,371
6,555
7,292
7.5
7.5
-
0.8
8,570.0
107.1
1.3
1.3
0.1
1.2
0.9
0.8
Solutions
Greaves Cotton
Neutral
118
-
2,880
1,778
1,993
14.7
15.1
8.1
9.1
14.6
13.0
3.3
3.1
21.8
23.6
1.4
1.2
Stock Watch
December 14, 2017
Company Name
Reco
CMP
Target
Mkt Cap
Sales ( Čcr )
OPM(%)
EPS (Č)
PER(x)
P/BV(x)
RoE(%)
EV/Sales(x)
(Č)
Price ( Č)
( Č cr )
FY18E FY19E
FY18E
FY19E
FY18E
FY19E
FY18E
FY19E
FY18E
FY19E
FY18E
FY19E
FY18E
FY19E
Capital Goods
KEC International
Accumulate
333
350
8,562
9,779
11,113
9.4
9.8
14.2
18.2
23.5
18.3
4.5
3.7
21.1
22.1
1.1
1.0
KEI Industries
Accumulate
382
436
2,995
3,001
3,391
10.0
10.0
13.0
16.1
29.4
23.7
5.3
4.4
18.2
18.7
1.2
1.0
Thermax
Neutral
1,151
-
13,715
4,125
4,747
10.3
10.8
26.7
31.5
43.1
36.5
4.8
4.4
11.2
12.0
3.1
2.7
VATech Wabag
Accumulate
614
681
3,352
3,867
4,126
9.6
10.0
34.9
39.8
17.6
15.4
2.9
2.5
17.7
17.5
0.9
0.8
Cement
ACC
Neutral
1,709
-
32,088
12,255
13,350
13.5
14.3
58.0
66.2
29.5
25.8
3.5
3.3
11.5
12.2
2.6
2.4
Ambuja Cements
Neutral
265
-
52,590
10,250
11,450
17.5
19.0
7.2
8.3
36.8
31.9
2.6
2.5
7.0
7.8
4.9
4.3
India Cements
Neutral
169
-
5,199
6,135
6,750
14.8
15.2
8.5
11.5
19.9
14.7
1.0
0.9
4.8
6.2
1.2
1.0
JK Cement
Neutral
1,054
-
7,370
4,150
4,775
19.2
20.0
49.0
63.5
21.5
16.6
3.4
2.9
17.0
18.5
2.2
1.9
J K Lakshmi Cement
Neutral
428
-
5,035
3,422
3,757
15.5
17.0
13.5
23.2
31.7
18.4
3.3
2.8
10.8
15.5
1.9
1.6
Orient Cement
Neutral
162
-
3,321
2,215
3,233
16.8
17.0
5.9
6.9
27.5
23.5
2.1
1.9
10.8
10.1
2.5
1.7
UltraTech Cement
Neutral
4,273
-
117,328
28,250
35,150
20.2
23.5
77.5
122.2
55.1
35.0
4.7
4.2
9.6
14.8
4.6
3.7
Construction
KNR Constructions
Neutral
268
-
3,771
1,846
2,203
14.5
14.5
12.1
13.7
22.2
19.6
1.2
1.1
17.5
16.7
2.1
1.7
Larsen & Toubro
Neutral
1,189
-
166,583
95,787
109,476
10.2
11.6
44.5
50.8
26.8
23.4
3.4
3.1
12.9
13.1
2.3
2.0
Gujarat Pipavav Port
Neutral
138
-
6,674
739
842
61.6
62.7
5.1
6.2
27.1
22.5
3.4
3.3
12.7
14.9
8.5
7.3
PNC Infratech
Neutral
183
-
4,704
2,040
2,935
13.0
13.0
6.4
9.0
28.7
20.4
0.7
0.7
9.7
12.2
2.3
1.7
Simplex Infra
Neutral
560
-
2,770
6,012
6,619
11.6
11.7
21.1
31.0
26.6
18.1
1.9
1.7
6.5
8.6
1.0
0.9
Sadbhav Engineering
Neutral
368
-
6,322
3,823
4,426
10.7
10.8
10.3
11.8
35.8
31.2
4.3
3.8
10.1
10.5
2.0
1.7
NBCC
Neutral
246
-
22,158
9,099
12,706
6.4
6.4
7.3
9.6
33.8
25.7
1.5
1.2
27.5
30.5
2.3
1.7
MEP Infra
Neutral
91
-
1,479
2,403
2,910
18.3
16.8
2.4
6.1
38.7
15.0
14.7
9.9
35.2
55.8
1.8
1.5
SIPL
Neutral
137
-
4,822
2,060
2,390
46.8
47.7
(5.8)
(3.1)
5.1
5.9
(14.2)
(2.3)
7.1
6.6
Engineers India
Neutral
186
-
12,527
1,795
2,611
21.1
22.4
5.9
8.1
31.5
23.0
2.3
2.2
12.9
16.1
5.4
3.5
Financials
Axis Bank
Accumulate
535
580
128,303
32,558
35,843
3.5
3.2
27.8
41.0
19.2
13.0
2.1
1.8
11.4
14.9
-
-
Bank of Baroda
Neutral
164
-
37,742
22,533
26,079
2.4
2.4
12.0
20.9
13.6
7.8
0.9
0.8
6.6
11.0
-
-
Canara Bank
Neutral
355
-
21,198
17,925
20,235
2.0
2.1
18.5
36.5
19.2
9.7
0.7
0.7
3.4
6.2
-
-
Can Fin Homes
Neutral
464
-
6,171
586
741
3.5
3.5
107.8
141.0
4.3
3.3
0.9
0.8
24.1
25.6
-
-
Cholamandalam Inv. &
Neutral
1,292
-
20,196
2,826
3,307
6.3
6.3
53.7
64.6
24.1
20.0
4.1
3.5
18.3
18.9
-
-
Fin. Co.
Dewan Housing Finance Buy
578
712
18,120
2,676
3,383
2.4
2.7
37.4
49.7
15.5
11.6
2.0
1.8
13.8
16.2
-
-
Equitas Holdings
Buy
137
235
4,639
1,125
1,380
9.6
9.8
1.5
6.0
91.1
22.8
2.1
1.9
2.4
8.2
-
-
Federal Bank
Buy
105
125
20,632
4,896
5,930
2.8
3.1
5.4
7.6
19.6
13.9
1.7
1.5
8.5
11.0
-
-
Stock Watch
December 14, 2017
Company Name
Reco
CMP
Target
Mkt Cap
Sales ( Čcr )
OPM(%)
EPS (Č)
PER(x)
P/BV(x)
RoE(%)
EV/Sales(x)
(Č)
Price ( Č)
( Č cr )
FY18E FY19E
FY18E
FY19E
FY18E
FY19E
FY18E
FY19E
FY18E
FY19E
FY18E
FY19E
FY18E
FY19E
Financials
GIC Housing
Buy
409
655
2,203
376
477
3.6
3.7
33.0
40.0
12.4
10.2
2.2
1.9
20.0
23.0
-
-
HDFC Bank
Neutral
1,822
-
471,545
55,236
63,253
4.5
4.4
68.9
82.4
26.5
22.1
4.6
3.8
18.7
18.5
-
-
ICICI Bank
Neutral
303
-
194,596
42,361
51,378
3.6
3.9
18.4
25.7
16.5
11.8
1.8
1.7
11.3
15.0
-
-
Karur Vysya Bank
Buy
116
180
8,371
3,289
3,630
3.7
3.9
10.8
14.1
10.7
8.2
1.3
1.1
12.5
14.7
-
-
LIC Housing Finance
Buy
544
630
27,469
4,895
6,332
3.4
3.7
50.7
66.8
10.7
8.2
2.1
1.8
21.7
23.8
-
-
Punjab Natl.Bank
Neutral
168
-
35,707
23,708
25,758
2.1
2.1
5.9
16.4
28.6
10.2
0.8
0.8
3.0
8.3
-
-
RBL Bank
Neutral
509
-
21,186
2,309
2,888
2.6
2.5
16.4
19.1
31.1
26.7
3.9
3.5
13.3
13.8
-
-
Repco Home Finance
Buy
640
825
4,005
496
597
4.4
4.2
38.5
48.7
16.6
13.1
3.0
2.5
19.6
20.6
-
-
South Ind.Bank
Neutral
31
-
5,625
3,195
3,567
3.0
3.1
3.0
3.8
10.3
8.1
1.0
0.9
10.5
11.9
-
-
St Bk of India
Neutral
313
-
270,399
105,827
121,056
2.4
2.5
16.1
25.6
19.5
12.3
1.5
1.4
6.6
9.9
-
-
Union Bank
Neutral
147
-
10,700
14,650
16,225
2.3
2.3
23.1
32.5
6.4
4.5
0.5
0.4
7.1
9.2
-
-
Yes Bank
Neutral
302
-
69,353
11,088
13,138
3.0
2.9
84.0
99.3
3.6
3.0
0.6
0.5
16.3
16.8
-
-
FMCG
Akzo Nobel India
Neutral
1,812
-
8,690
3,164
3,607
13.8
13.7
58.6
67.9
30.9
26.7
7.6
6.7
24.5
25.1
2.6
2.3
Asian Paints
Neutral
1,117
-
107,099
17,603
20,615
18.6
18.6
2,128.9
2,543.3
0.5
0.4
11.1
9.3
28.0
28.9
5.9
5.0
Britannia
Neutral
4,807
-
57,712
9,690
11,278
14.8
15.4
84.0
101.0
57.2
47.6
20.9
16.6
40.6
39.0
5.9
5.1
Colgate
Neutral
1,051
-
28,572
4,420
5,074
24.9
25.3
28.6
32.8
36.7
32.0
14.5
11.7
43.8
40.5
6.2
5.4
Dabur India
Neutral
345
-
60,720
8,346
9,344
19.6
19.9
7.8
9.0
44.2
38.3
8.9
8.1
25.2
24.8
6.9
6.1
GlaxoSmith Con*
Neutral
6,249
-
26,281
5,072
5,760
18.2
18.4
176.3
199.2
35.5
31.4
7.5
6.8
21.2
21.7
4.5
3.9
Godrej Consumer
Neutral
994
-
67,724
10,171
11,682
20.8
21.5
21.7
27.1
45.8
36.7
10.3
8.9
22.3
23.4
6.8
5.8
HUL
Neutral
1,317
-
284,964
37,077
41,508
20.3
21.8
5,189.9
6,318.5
0.3
0.2
40.1
34.3
74.8
82.0
7.5
6.7
ITC
Neutral
259
-
315,736
44,588
49,853
37.0
37.3
9.6
11.0
27.0
23.6
6.6
6.3
25.1
27.3
6.6
5.8
Marico
Neutral
308
-
39,717
6,788
7,766
18.5
19.2
7.1
8.5
43.3
36.2
15.2
13.0
36.9
38.0
5.7
5.0
Nestle*
Neutral
7,912
-
76,286
10,083
11,182
20.0
20.9
119.7
141.3
66.1
56.0
233.0
212.9
36.7
39.8
7.2
6.5
Tata Global
Neutral
284
-
17,952
7,121
7,641
11.9
12.3
6.9
8.0
41.2
35.6
2.8
2.6
6.8
7.2
2.3
2.1
Procter & Gamble
Neutral
9,410
-
30,546
3,034
3,579
27.1
27.7
167.7
198.8
56.1
47.3
15.1
13.0
28.8
29.5
9.5
8.0
Hygiene
IT
HCL Tech^
Buy
867
1,014
123,698
50,009
54,608
22.1
22.1
62.8
67.6
13.8
12.8
3.1
2.6
22.4
20.6
2.1
1.8
Infosys
Accumulate
1,003
1,120
230,492
70,333
75,960
26.0
26.0
61.7
65.9
16.3
15.2
3.1
2.9
18.9
18.7
2.7
2.4
TCS
Reduce
2,627
2,442
502,941
123,384
134,488
26.1
26.1
133.2
143.7
19.7
18.3
5.4
5.1
27.6
27.8
3.7
3.4
Tech Mahindra
Neutral
502
-
49,021
30,545
32,988
15.0
15.0
35.2
37.6
14.3
13.4
2.4
2.3
16.8
16.2
1.4
1.2
Stock Watch
December 14, 2017
Company Name
Reco
CMP
Target
Mkt Cap
Sales ( Čcr )
OPM(%)
EPS (Č)
PER(x)
P/BV(x)
RoE(%)
EV/Sales(x)
(Č)
Price ( Č)
( Č cr )
FY18E FY19E
FY18E
FY19E
FY18E
FY19E
FY18E
FY19E
FY18E
FY19E
FY18E
FY19E
FY18E
FY19E
IT
Wipro
Neutral
287
-
139,771
54,164
56,544
22.3
22.3
18.8
19.5
15.3
14.7
2.4
2.1
15.0
13.6
1.8
1.6
Media
D B Corp
Neutral
350
-
6,432
2,404
2,625
30.5
31.5
23.7
26.9
14.8
13.0
3.5
3.0
23.5
22.8
2.5
2.3
HT Media
Neutral
96
-
2,231
2,589
2,830
15.1
15.4
8.3
10.9
11.6
8.8
0.9
0.9
8.4
10.4
0.4
0.3
Jagran Prakashan
Buy
168
225
5,222
2,541
2,835
28.5
28.7
12.7
14.1
13.2
11.9
2.7
2.4
21.3
21.4
1.9
1.6
Sun TV Network
Neutral
914
-
36,035
3,238
3,789
51.9
55.1
30.9
38.0
29.6
24.1
8.4
7.4
30.0
31.0
10.6
9.0
Hindustan Media
Neutral
232
-
1,701
1,002
1,074
23.3
23.5
29.2
33.8
7.9
6.9
1.2
1.1
15.6
15.4
0.7
0.4
Ventures
TV Today Network
Accumulate
387
435
2,307
667
727
27.7
27.7
18.6
20.1
20.8
19.3
3.2
3.3
15.6
17.3
3.0
2.8
Music Broadcast Limited Accumulate
385
434
2,197
271
317
91.0
109.0
6.0
10.0
64.2
38.5
4.0
3.6
6.5
9.3
7.7
6.3
Metals & Mining
Coal India
Neutral
263
-
163,007
82,301
91,235
17.0
18.0
17.1
20.5
15.4
12.8
2.9
2.7
45.0
55.0
1.7
1.5
Hind. Zinc
Neutral
289
-
121,985
22,108
24,555
57.0
58.0
22.1
26.3
13.1
11.0
4.2
3.4
32.0
35.0
4.5
3.7
Hindalco
Neutral
234
-
52,629
102,350
105,355
13.5
14.5
21.5
24.5
10.9
9.6
1.5
1.3
15.0
15.2
1.1
1.0
JSW Steel
Neutral
244
-
58,884
64,500
68,245
21.1
21.5
20.1
21.2
12.1
11.5
2.2
1.9
-
-
1.6
1.6
NMDC
Neutral
128
-
40,624
10,209
11,450
47.0
48.0
11.1
12.1
11.6
10.6
1.6
1.5
-
-
3.5
3.2
SAIL
Neutral
79
-
32,504
54,100
63,555
3.0
10.0
(10.0)
1.5
52.5
1.1
1.0
-
-
1.6
1.4
Vedanta
Neutral
284
-
105,401
81,206
87,345
28.0
29.0
26.5
33.5
10.7
8.5
2.4
2.1
-
-
2.0
1.7
Tata Steel
Neutral
682
-
66,247
121,445
126,500
16.2
17.2
65.4
81.3
10.4
8.4
1.7
1.4
-
-
1.1
0.9
Oil & Gas
GAIL
Neutral
492
-
83,128
53,115
52,344
14.2
15.3
30.0
31.1
16.4
15.8
2.1
1.9
-
-
1.3
1.3
ONGC
Neutral
184
-
235,811
83,111
84,934
44.2
44.9
16.4
16.9
11.2
10.9
1.4
1.3
-
-
2.7
2.7
Indian Oil Corp
Neutral
402
-
195,305
396,116
432,560
8.5
8.8
40.1
42.2
10.0
9.5
1.7
1.6
-
-
0.6
0.6
Reliance Industries
Neutral
914
-
594,448
257,711
267,438
17.0
18.2
89.1
89.5
10.3
10.2
1.0
0.9
-
-
2.0
1.9
Pharmaceuticals
Alembic Pharma
Accumulate
523
600
9,862
3,346
3,915
19.6
19.2
21.0
23.9
24.9
21.9
4.4
3.7
19.1
18.4
2.9
2.6
Alkem Laboratories Ltd
Accumulate
2,094
2,341
25,041
6,320
7,341
17.5
19.8
72.7
96.6
28.8
21.7
5.1
4.3
16.7
18.7
3.9
3.3
Aurobindo Pharma
Buy
669
823
39,175
17,086
19,478
22.1
22.0
44.7
51.4
15.0
13.0
3.3
2.7
24.7
22.7
2.4
2.1
Aventis*
Neutral
4,670
-
10,754
2,411
2,698
18.8
18.8
151.6
163.9
30.8
28.5
4.8
3.9
25.4
27.5
4.0
3.4
Cadila Healthcare
Neutral
408
-
41,764
11,365
12,926
20.0
20.0
18.4
20.5
22.2
19.9
4.9
4.0
24.3
22.2
3.8
3.3
Cipla
Sell
578
462
46,531
16,163
18,711
16.6
16.9
20.7
24.3
27.9
23.8
3.3
3.0
12.6
13.1
3.0
2.6
Dr Reddy's
Reduce
2,261
2,040
37,489
13,734
15,548
17.7
20.2
69.9
102.0
32.3
22.2
2.9
2.6
9.2
12.4
3.0
2.6
GSK Pharma*
Sell
2,419
2,000
20,491
2,968
3,324
13.8
15.9
37.8
46.3
64.0
52.3
11.2
12.3
16.7
22.4
6.7
6.1
Indoco Remedies
Sell
272
136
2,511
1,114
1,297
9.9
13.9
5.6
11.4
48.7
23.9
3.7
3.3
7.7
14.5
2.5
2.1
Stock Watch
December 14, 2017
Company Name
Reco
CMP
Target
Mkt Cap
Sales ( Čcr )
OPM(%)
EPS (Č)
PER(x)
P/BV(x)
RoE(%)
EV/Sales(x)
(Č)
Price ( Č)
( Č cr )
FY18E FY19E
FY18E
FY19E
FY18E
FY19E
FY18E
FY19E
FY18E
FY19E
FY18E
FY19E
FY18E
FY19E
Pharmaceuticals
Ipca labs
Neutral
551
-
6,955
3,256
3,647
14.1
17.1
16.2
25.4
34.0
21.7
2.6
2.4
8.0
11.5
2.2
2.0
Lupin
Buy
844
1,091
38,127
16,240
18,562
21.3
21.7
42.5
49.6
19.9
17.0
2.5
2.2
13.3
13.7
2.4
2.1
Natco Pharma
Accumulate
962
1,057
16,783
1,886
2,016
32.3
29.5
23.2
22.0
41.6
43.6
8.7
7.7
20.9
17.6
8.8
8.2
Sun Pharma
Buy
517
615
123,993
28,312
31,826
20.7
22.4
18.5
22.3
27.9
23.2
3.2
2.9
11.5
14.0
4.0
3.5
Syngene International
Accumulate
535
587
10,700
1,394
1,818
33.0
36.5
15.8
21.0
33.8
25.5
6.3
5.2
18.6
20.3
7.6
5.9
Power
Tata Power
Neutral
90
-
24,424
32,547
33,806
20.5
20.5
4.7
5.4
19.2
16.9
1.8
1.6
10.5
10.5
1.7
1.7
NTPC
Neutral
176
-
144,914
86,070
101,246
28.3
30.7
12.9
16.2
13.6
10.9
1.4
1.3
10.6
12.4
3.0
2.7
Power Grid
Accumulate
201
223
105,024
29,183
32,946
89.7
90.0
18.0
20.8
11.2
9.7
1.9
1.7
17.7
18.2
7.5
7.0
Real Estate
Prestige Estate
Neutral
293
-
10,978
4,607
5,146
21.0
22.2
7.9
9.8
37.1
29.9
2.3
2.1
10.3
12.0
3.6
3.2
MLIFE
Accumulate
454
522
2,332
487
590
12.3
17.8
21.0
31.2
21.6
14.6
1.1
1.1
5.2
7.4
3.5
2.9
Telecom
Bharti Airtel
Neutral
517
-
206,646
97,903
105,233
36.0
36.3
9.3
11.1
55.6
46.8
2.7
2.5
5.0
5.6
3.1
2.8
Idea Cellular
Neutral
93
-
33,477
35,012
37,689
27.1
27.7
(4.4)
(2.7)
1.4
1.5
(6.8)
(4.6)
2.3
2.0
zOthers
Abbott India
Neutral
5,540
-
11,773
3,244
3,723
14.9
16.1
167.5
209.4
33.1
26.5
7.3
6.1
23.7
24.8
3.3
2.8
Asian Granito
Accumulate
509
570
1,531
1,169
1,286
12.5
12.5
16.0
19.7
31.9
25.8
3.4
3.0
10.7
11.6
1.5
1.4
Bajaj Electricals
Neutral
467
-
4,746
4,646
5,301
6.7
7.6
16.1
22.3
29.0
20.9
4.7
4.0
16.4
19.2
1.0
0.9
Banco Products (India)
Neutral
246
-
1,756
1,530
1,695
13.2
12.7
19.0
20.0
12.9
12.3
2.1
1.8
0.2
0.2
1.1
118.1
Coffee Day Enterprises
Neutral
275
-
5,663
3,494
3,913
17.4
18.0
4.8
5.7
-
48.2
2.4
2.3
-
0.1
2.1
1.8
Ltd
Elecon Engineering
Neutral
89
-
999
171
201
15.0
16.2
36.0
43.0
2.5
2.1
0.2
0.2
0.1
0.1
5.2
4.4
Garware Wall Ropes
Neutral
922
-
2,018
928
1,003
15.2
15.2
39.4
43.2
23.4
21.4
3.9
3.3
16.5
15.4
2.0
1.8
Goodyear India*
Neutral
870
-
2,006
1,717
1,866
11.8
12.3
47.9
49.8
18.2
17.5
2.8
2.4
15.6
15.7
0.9
123.8
Hitachi
Neutral
2,500
-
6,798
2,355
2,715
10.3
10.8
49.0
60.9
51.0
41.1
11.9
9.4
0.2
0.2
2.9
2.5
HSIL
Neutral
490
-
3,542
2,240
2,670
14.6
15.0
17.0
22.0
28.8
22.3
2.4
2.3
0.1
0.1
1.8
1.5
Interglobe Aviation
Neutral
1,136
-
43,646
22,570
27,955
14.2
15.0
63.6
81.8
17.9
13.9
9.4
7.9
0.5
0.6
1.6
1.2
Jyothy Laboratories
Neutral
366
-
6,660
1,781
2,044
14.1
15.0
9.4
10.5
39.2
34.9
8.3
7.8
0.2
0.2
4.0
3.4
Linc Pen & Plastics
Neutral
363
-
537
420
462
9.3
9.3
15.3
17.1
23.7
21.2
4.0
4.1
16.9
19.5
1.3
1.2
M M Forgings
Neutral
1,021
-
1,232
542
642
20.1
21.0
41.6
56.8
24.5
18.0
3.4
2.9
0.1
0.2
2.7
2.3
Mirza International
Neutral
156
-
1,879
1,148
1,285
18.0
18.0
8.0
9.4
19.4
16.7
3.2
2.7
16.3
16.1
1.8
1.6
Navkar Corporation
Buy
192
265
2,885
561
617
41.5
41.5
11.5
12.7
16.7
15.1
1.8
1.6
10.5
10.4
5.8
5.1
Nilkamal
Neutral
1,783
-
2,660
2,317
2,525
11.4
11.1
96.0
105.0
18.6
17.0
3.2
2.8
0.2
0.2
1.1
1.0
Stock Watch
December 14, 2017
Company Name
Reco
CMP
Target Mkt Cap
Sales ( Čcr )
OPM(%)
EPS (Č)
PER(x)
P/BV(x)
RoE(%)
EV/Sales(x)
(Č)
Price ( Č)
( Č cr )
FY18E FY19E FY18E FY19E FY18E FY19E FY18E FY19E FY18E FY19E FY18E FY19E FY18E FY19E
zOthers
Parag Milk Foods
Neutral
272
-
2,284
1,987
2,379
7.6
9.0
12.4
18.3
21.9
14.8
3.1
2.7
8.2
13.2
1.3
1.1
Radico Khaitan
Neutral
270
-
3,594
1,811
1,992
13.2
13.2
8.1
8.8
33.3
30.6
3.4
3.7
10.1
12.0
2.3
2.1
Relaxo Footwears
Neutral
652
-
7,841
1,981
2,310
13.7
14.5
12.0
15.5
54.3
42.0
10.6
8.6
0.2
0.2
4.0
3.4
Siyaram Silk Mills
Accumulate
728
800
3,412
1,769
1,981
12.7
12.7
22.6
26.2
32.2
27.8
5.0
4.3
15.5
15.5
2.1
1.9
Styrolution ABS India* Neutral
1,067
-
1,876
1,800
1,980
8.0
8.1
42.0
46.2
25.4
23.1
2.8
2.5
0.1
0.1
1.2
1.1
Surya Roshni
Neutral
372
-
1,629
4,870
5,320
7.7
7.8
22.8
28.1
16.3
13.2
2.2
1.9
0.1
0.1
0.6
0.5
TVS Srichakra
Neutral
3,318
-
2,540
2,729
2,893
12.7
12.5
248.5
265.0
13.4
12.5
3.8
3.1
0.3
0.3
0.9
0.9
Visaka Industries
Neutral
618
-
981
1,104
1,214
12.1
12.6
31.0
37.9
19.9
16.3
2.4
2.2
0.1
0.1
1.1
1.0
VIP Industries
Buy
340
400
4,811
1,450
1,693
10.4
10.5
6.5
7.8
52.0
43.6
11.0
9.6
21.1
22.1
3.3
2.8
Navin Fluorine
Accumulate
691
730
3,410
945
1,154
17.5
17.9
28.7
34.8
24.1
19.9
4.0
3.4
-
-
3.1
2.4
Source: Company, Angel Research; Note: *December year end; #September year end; &October year end; Price as on December 13, 2017
Market Outlook
December 14, 2017
Research Team Tel: 022 - 39357800
DISCLAIMER
Angel Broking Private Limited (hereinafter referred to as “Angel”) is a registered Member of National Stock Exchange of India
Limited,Bombay Stock Exchange Limited and Metropolitan Stock Exchange Limited. It is also registered as a Depository Participant with
CDSL and Portfolio Manager with SEBI. It also has registration with AMFI as a Mutual Fund Distributor. Angel Broking Private Limited is a
registered entity with SEBI for Research Analyst in terms of SEBI (Research Analyst) Regulations, 2014 vide registration number
INH000000164. Angel or its associates has not been debarred/ suspended by SEBI or any other regulatory authority for accessing
/dealing in securities Market. Angel or its associates/analyst has not received any compensation / managed or
co-managed public offering of securities of the company covered by Analyst during the past twelve months.
This document is solely for the personal information of the recipient, and must not be singularly used as the basis of any investment
decision. Nothing in this document should be construed as investment or financial advice. Each recipient of this document should make
such investigations as they deem necessary to arrive at an independent evaluation of an investment in the securities of the companies
referred to in this document (including the merits and risks involved), and should consult their own advisors to determine the merits and
risks of such an investment.
Reports based on technical and derivative analysis center on studying charts of a stock's price movement, outstanding positions and
trading volume, as opposed to focusing on a company's fundamentals and, as such, may not match with a report on a company's
fundamentals. Investors are advised to refer the Fundamental and Technical Research Reports available on our website to evaluate the
contrary view, if any.
The information in this document has been printed on the basis of publicly available information, internal data and other reliable
sources believed to be true, but we do not represent that it is accurate or complete and it should not be relied on as such, as this
document is for general guidance only. Angel Broking Pvt. Limited or any of its affiliates/ group companies shall not be in any way
responsible for any loss or damage that may arise to any person from any inadvertent error in the information contained in this report.
Angel Broking Pvt. Limited has not independently verified all the information contained within this document. Accordingly, we cannot
testify, nor make any representation or warranty, express or implied, to the accuracy, contents or data contained within this document.
While Angel Broking Pvt. Limited endeavors to update on a reasonable basis the information discussed in this material, there may be
regulatory, compliance, or other reasons that prevent us from doing so.
This document is being supplied to you solely for your information, and its contents, information or data may not be reproduced,
redistributed or passed on, directly or indirectly.
Neither Angel Broking Pvt. Limited, nor its directors, employees or affiliates shall be liable for any loss or damage that may arise from
or in connection with the use of this information.